Using Stream Analytics to Filter AKS Control Plane Logs
Using Azure Stream Analytics to filter Kubernetes control plane log data from AKS diagnostics in order to isolate critical data and reduce log retention cost.
Posted on: Aug 15, 2024

Filtering AKS Control Plane Logs with Azure Stream Analytics
Introduction
While AKS does NOT provide access to the cluster’s managed control plane, it does provide access to the control plane component logs via diagnostic settings. The easiest option to persist and search this data is to send it directly to Azure Log Analytics, however there is a LOT of data in those logs, which makes it cost prohibitive in Log Analytics. Alternatively, you can send all the data to an Azure Storage Account, but then searching and alerting can be challenging.
To address the above challenge, one option is to stream the data to Azure Event Hub, which then gives you the option to use Azure Stream Analytics to filter out events that you deem important and then just store the rest in cheaper storage (ex. Azure Storage) for potential future diagnostic needs.
In this walkthrough we’ll create an AKS cluster, enable diagnostic logging to Azure Stream Analytics and then demonstrate how to filter out some key records.
Cluster & Stream Analytics Setup
In this setup, the cluster will be a very basic single node AKS cluster that will simply have diagnostic settings enabled. We’ll also create the Event Hub instance that will be used in the diagnostic settings.
# Set some environment variables
RG=LogFilteringLab
LOC=eastus2
CLUSTER_NAME=logfilterlab
NAMESPACE_NAME="akscontrolplane$RANDOM"
EVENT_HUB_NAME="logfilterhub$RANDOM"
DIAGNOSTIC_SETTINGS_NAME="demologfilter"

# Create a resource group
az group create -n $RG -l $LOC

# Create the AKS Cluster
az aks create \
-g $RG \
-n $CLUSTER_NAME \
-c 1

# Get the cluster credentials
az aks get-credentials -g $RG -n $CLUSTER_NAME

# Create an Event Hub Namespace
az eventhubs namespace create --name $NAMESPACE_NAME --resource-group $RG -l $LOC

# Create an event hub
az eventhubs eventhub create --name $EVENT_HUB_NAME --resource-group $RG --namespace-name $NAMESPACE_NAME

AKS_CLUSTER_ID=$(az aks show -g $RG -n $CLUSTER_NAME -o tsv --query id)
EVENT_HUB_NAMESPACE_ID=$(az eventhubs namespace show -g $RG -n $NAMESPACE_NAME -o tsv --query id)

# Apply the diagnostic settings to the AKS cluster to enable Kubernetes audit log shipping
# to our Event Hub
az monitor diagnostic-settings create \
--resource $AKS_CLUSTER_ID \
-n $DIAGNOSTIC_SETTINGS_NAME \
--event-hub $EVENT_HUB_NAME \
--event-hub-rule "${EVENT_HUB_NAMESPACE_ID}/authorizationrules/RootManageSharedAccessKey" \
--logs '[ { "category": "kube-audit", "enabled": true, "retentionPolicy": { "enabled": false, "days": 0 } } ]'
Stream Analytics
As we’ll use Stream Analytics to filter through the log messages for what we want to capture, we’ll need to create a Stream Analytics Job. This job will take the Event Hub as it’s input source, will run a query and will send the query results to an output target. This output target can be a number of options, but for the purposes of our test we’ll write the filtered records out to a Service Bus Queue, which we can watch in real time.
We have the Event Hub already, now lets create the Azure Service Bus Queue and then the Stream Analytics Job to tie it all together.
Create the Service Bus Queue
SERVICE_BUS_NAMESPACE_NAME=kubecontrolplanelogs
SERVICE_BUS_QUEUE_NAME=kubeaudit

# Create the service bus namespace
az servicebus namespace create --resource-group $RG --name $SERVICE_BUS_NAMESPACE_NAME --location $LOC

# Create the service bus queue
az servicebus queue create --resource-group $RG --namespace-name $SERVICE_BUS_NAMESPACE_NAME --name $SERVICE_BUS_QUEUE_NAME
Stream Analytics Job
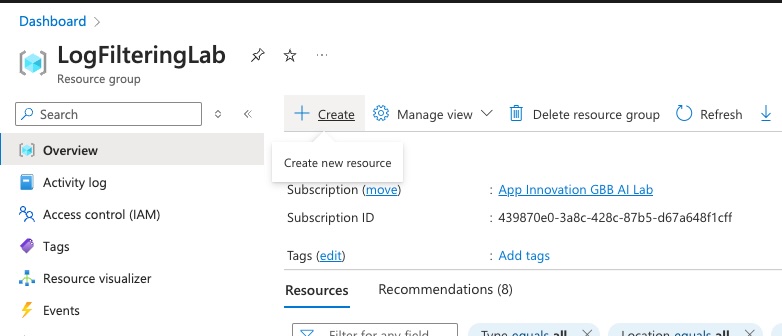
For the Stream Analytics Job we’ll switch over to the portal, so go ahead and open https://portal.azure.com and navigate to your resource group.
-
Click on the ‘Create’ button at the top of your resource group:
-
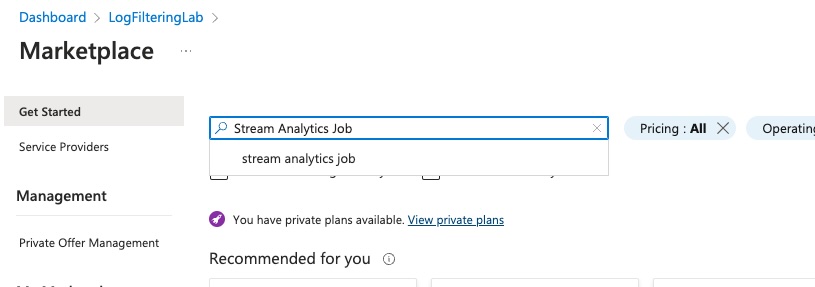
Search for ‘Stream Analytics Job’
-
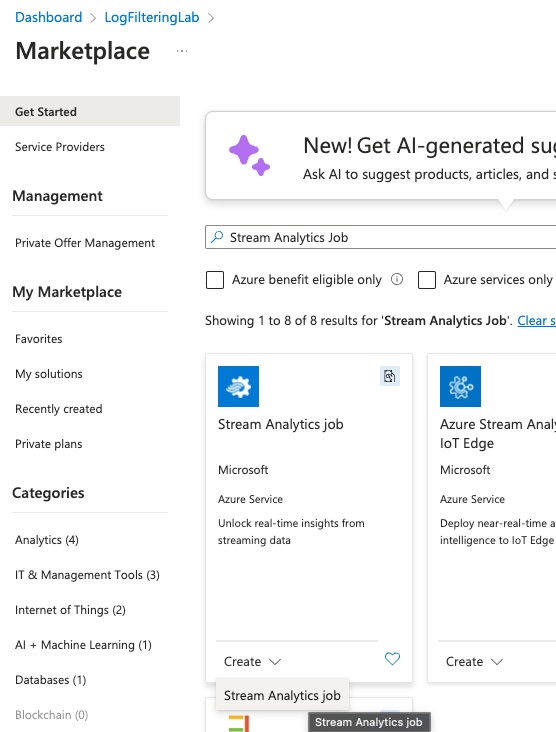
Click ‘Create’ on the Stream Analytics Job search result
-
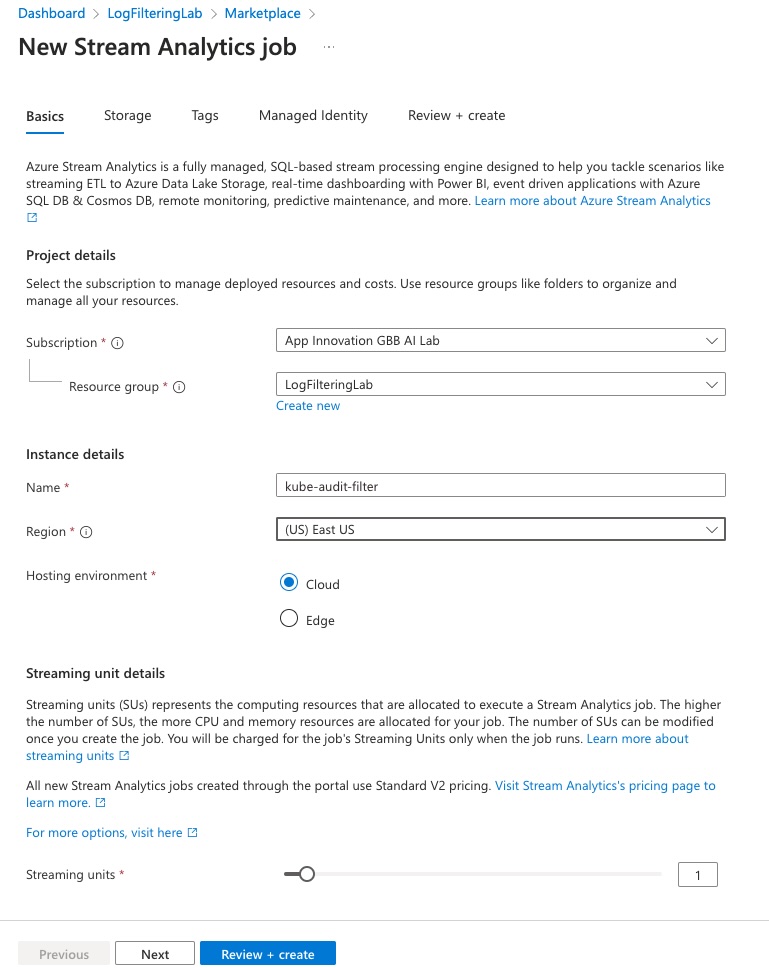
Leave all defaults, but provide a name under the ‘Instance Details’ section and then click ‘Review + Create’
-
After the validation is complete, just click ‘Create’. This typically completes very quickly.
-
Click on ‘Go to Resource’ or navigate back to your resource group and click on the Stream Analytics Job you just created.
-
In the stream analytics job, expand ‘Job topology’ and then click on ‘Inputs’ so we can add our Event Hub input
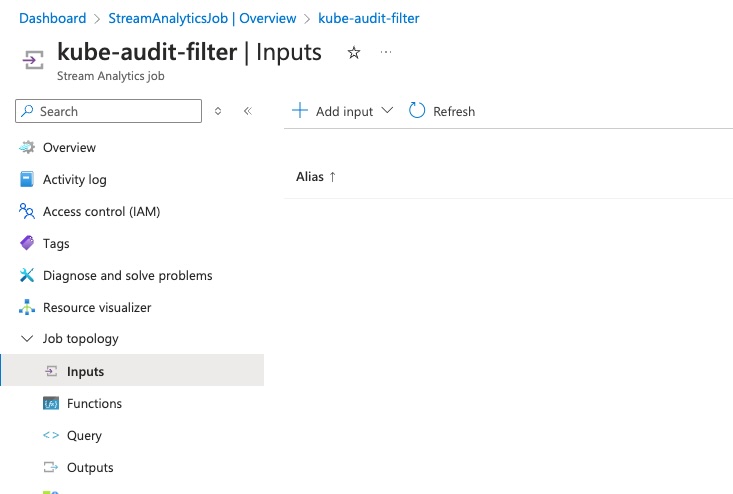
-
Click on ‘Add Input’ and select ‘Event Hub’
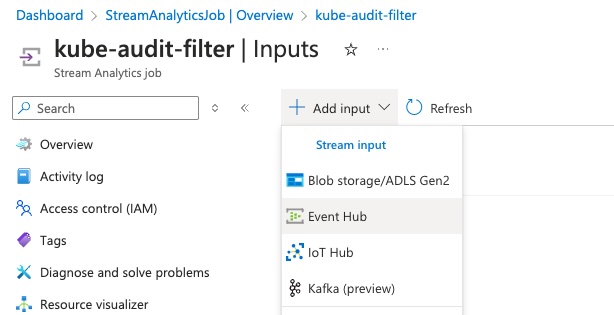
-
The Event Hub’s new input creation pane should auto-populate with your Event Hub details as well as default to creation of a new access policy, but verify that all of the details are correct and then click ‘Save’.
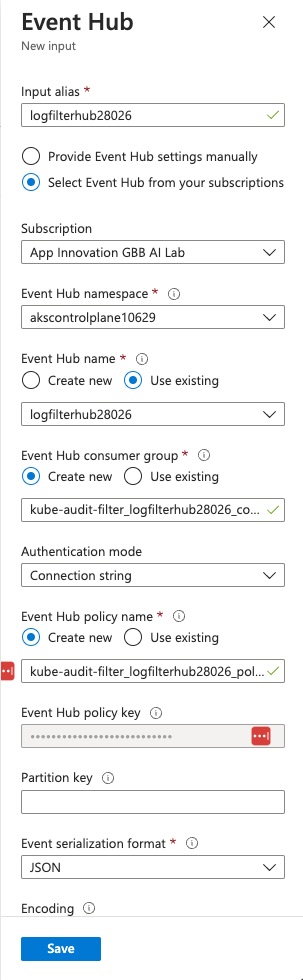
-
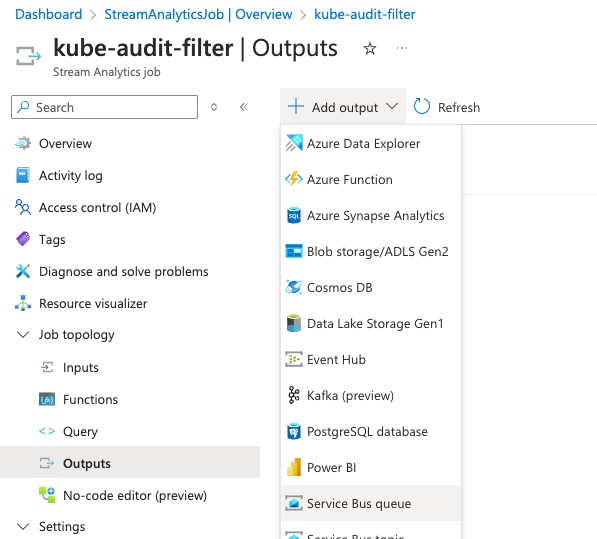
Now we need to attach the Service Bus we created as the output target, so under ‘Job topology’ click on ‘Outputs’.
-
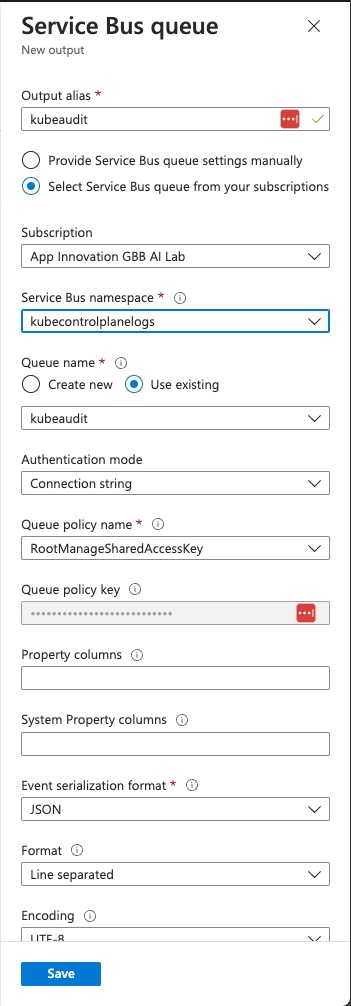
In the ‘Outputs’ window, click on ‘Add output’ and select ‘Service Bus queue’
-
Again, it should bring up a window with the queue configuration details already pre-populated, but verify all the details and update as needed and then click ‘Save’.
-
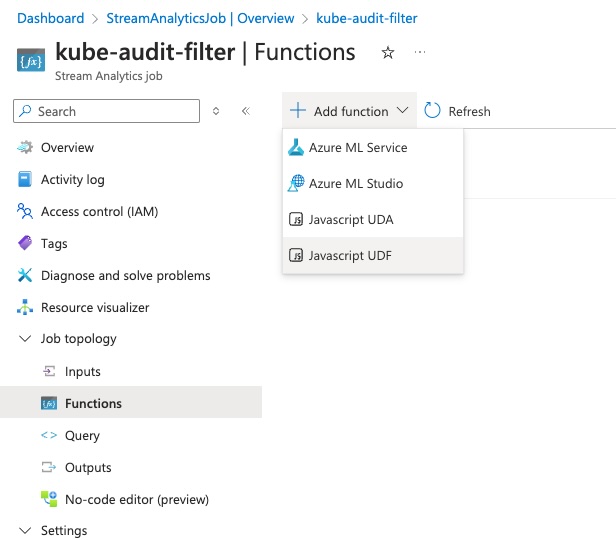
To process the records from AKS we’ll need to parse some JSON, so we need to add a function to the Stream Analytics Job to parse JSON. Under ‘Job topology’ click on ‘Functions’.
-
In the functions window, click on ‘Add Function’ and then select ‘Javascript UDF’ for Javascript User Defined Function
- In the ‘Function alias’ name the function ‘jsonparse’ and in the editor window add the following:
function main(x) {
var json = JSON.parse(x);
return json;
}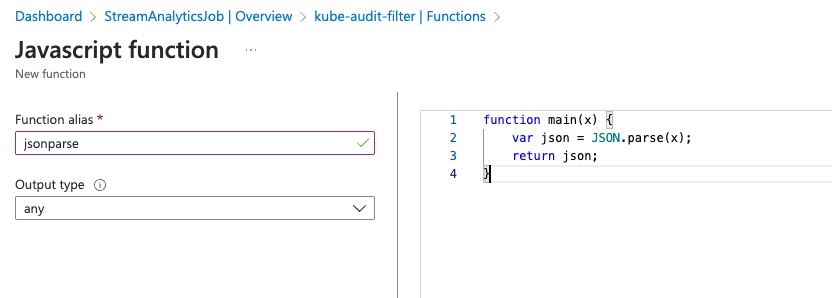
-
Click on ‘Save’ to save the function
-
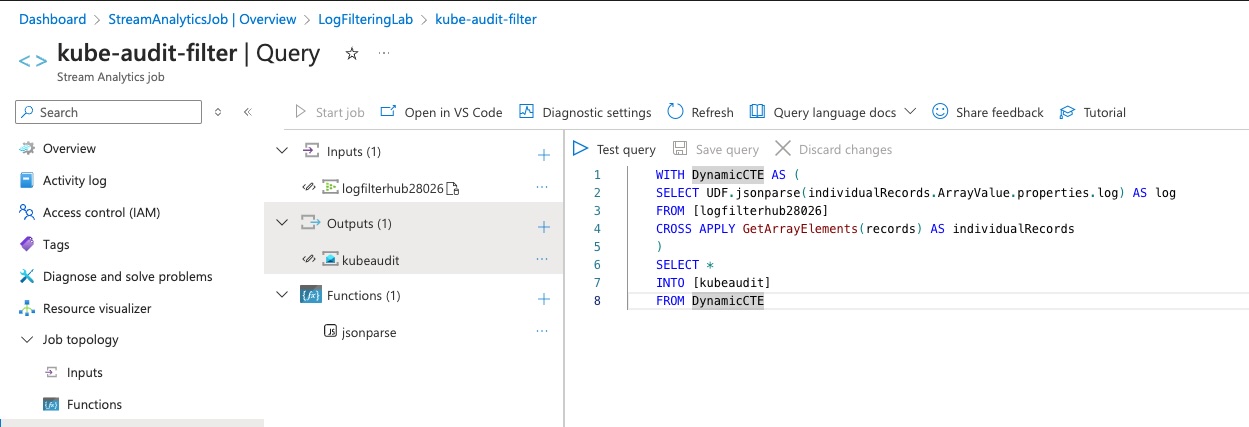
Now, under ‘Job topology’ in the stream analytics job, click on ‘Query’ to start adding a query. When loaded, the inputs, outputs and functions should pre-populate for you.
-
We’ll first create a basic query to select all records and ship them to the output target. In the query window paste the following, updating the input and output values to match the names of your input and output. The function name should be the same unless you changed it.
WITH DynamicCTE AS ( SELECT UDF.jsonparse(individualRecords.ArrayValue.properties.log) AS log FROM [logfilterhub28026] CROSS APPLY GetArrayElements(records) AS individualRecords ) SELECT * INTO [kubeauditlogs] FROM DynamicCTE -
Click ‘Save Query’ at the top of the query window
-
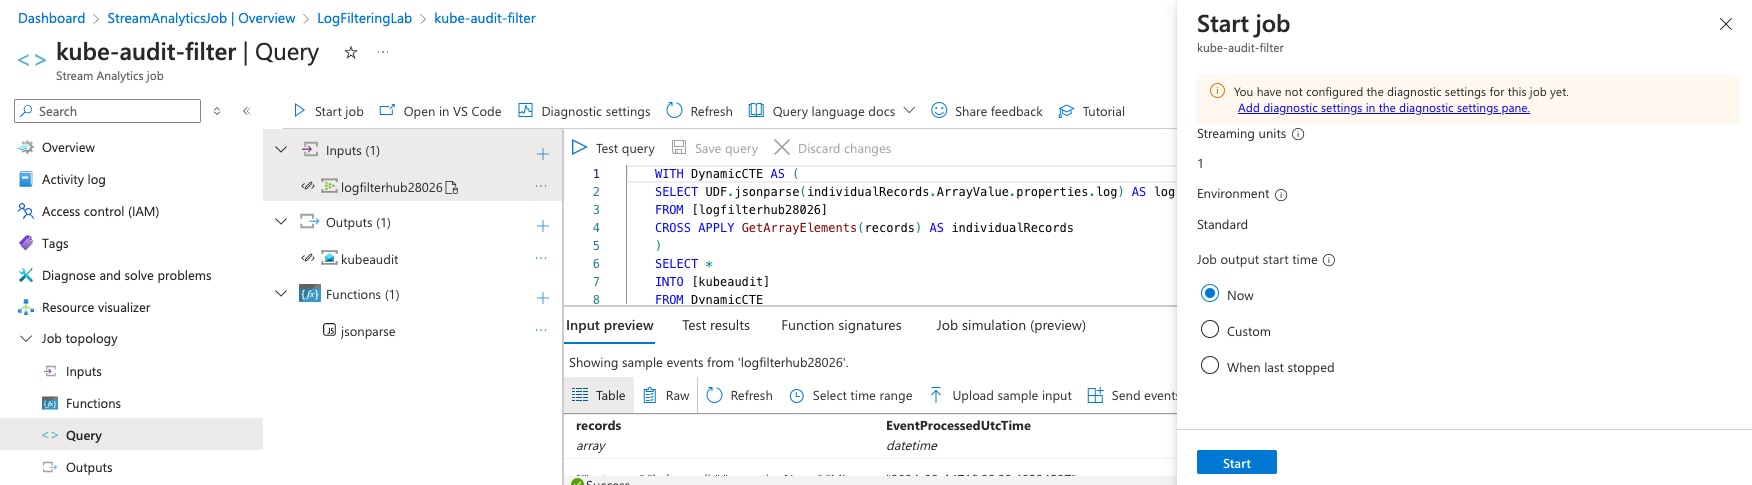
In the top left of the query window, click on ‘Start Job’ to kick off the stream analytics job.
-
In the ‘Start job’ window, leave the start time set to ‘Now’ and click ‘Start’
-
Click on the ‘Overview’ tab in the stream analytics job, and refresh every once in a while until the job ‘Status’ says ‘Running’
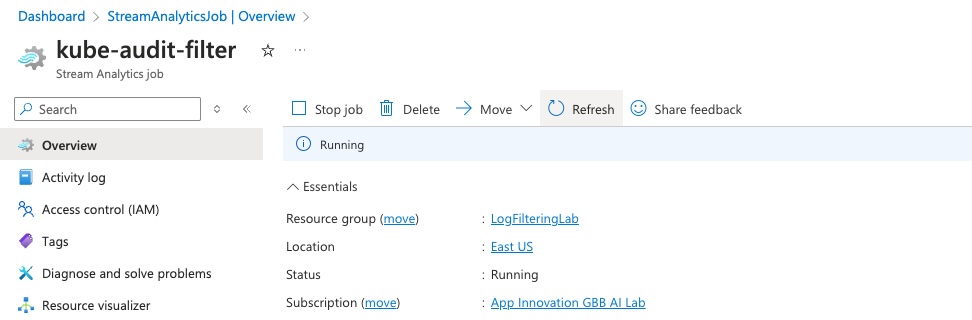
-
Navigate back to your Resource Group and then click on your service bus namespace.
-
Assuming everything worked as expected you should now be seeing a lot of messages coming through the Service Bus Queue
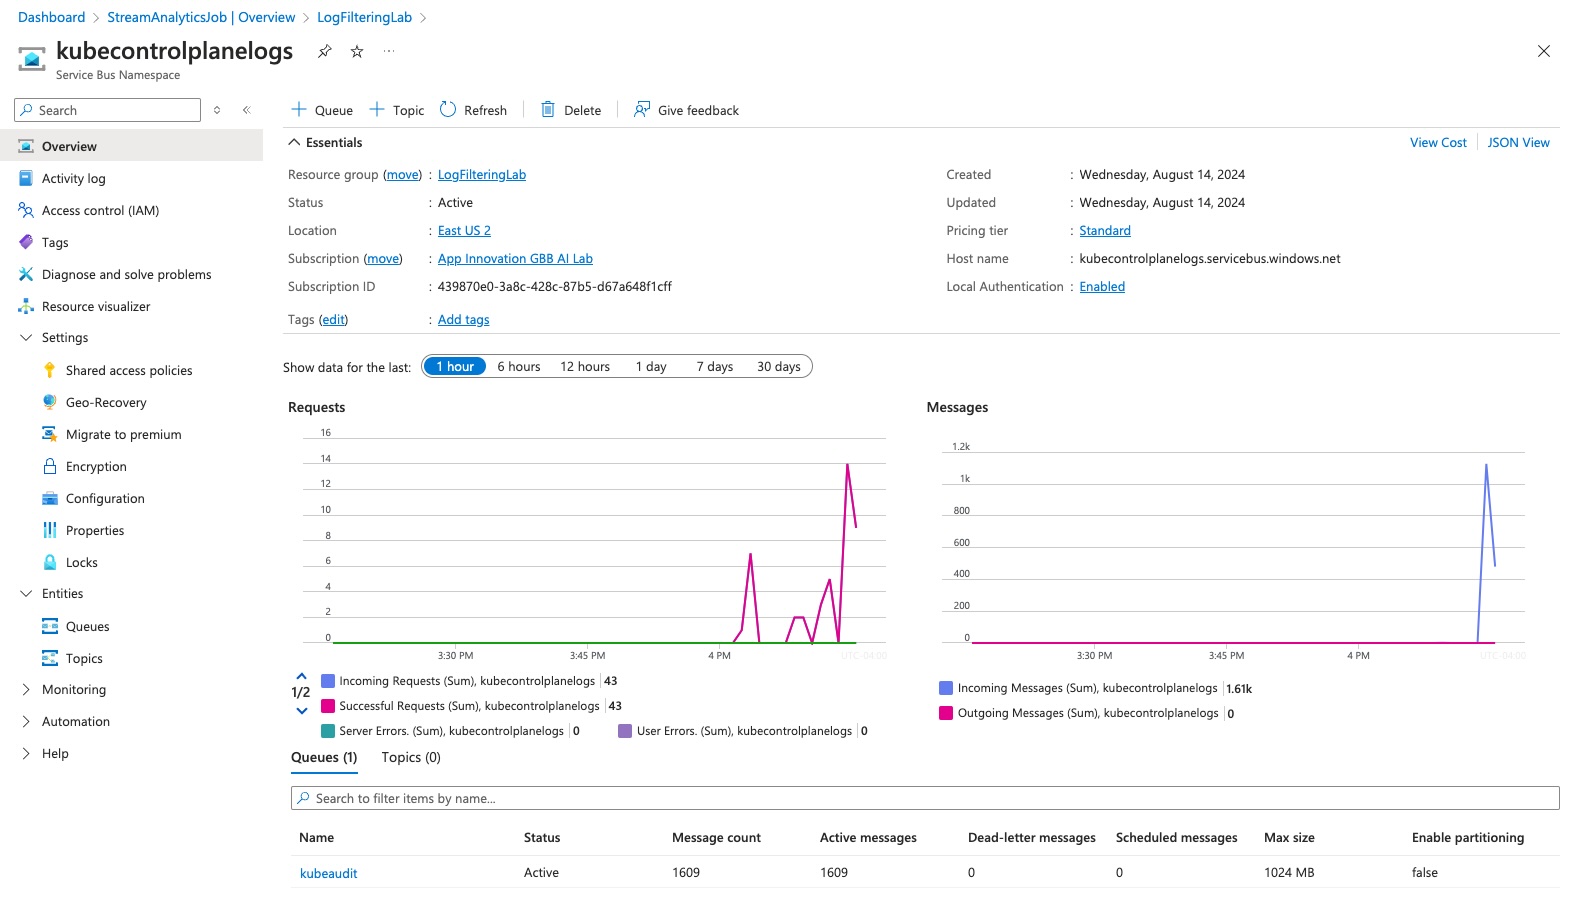
-
Click on the queue at the bottom of the screen to open the Queue level view
-
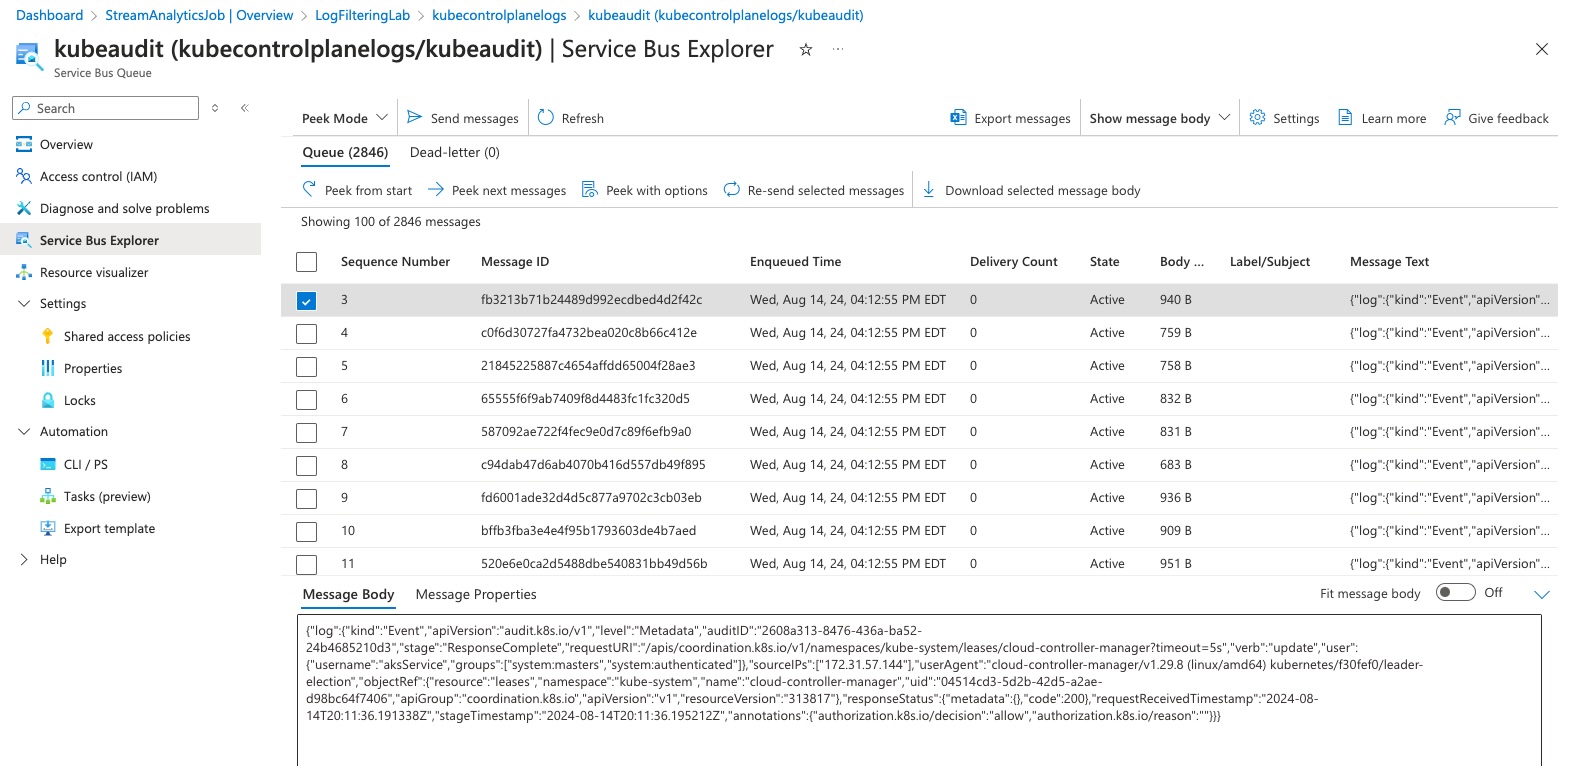
At the queue level, click on ‘Service Bus Explorer’ to view the live records
-
To view the records already created’ click on ‘Peek from start’ and then choose a record to view
- Navigate back to the stream analytics job and click on ‘Stop job’ to stop sending records through to the service bus.
Great! You should now have a very basic stream analytics job that takes the control plane ‘kube-audit’ log from an AKS cluster through Event Hub, queries that data and then pushes it to a Service Bus Queue. While this is great, the goal is to filter out some records, so lets move on to that!
Setup a test workload to trigger audit log entries
To test out our stream analytics query, we need some test data we can filter on. Let’s create some requests to the API server that will be denied. To do that we’ll create a service account with no rights and then create a test pod using that service account. We’ll then use the service account token to try to reach the Kubernetes API server.
# Create a new namespace
kubectl create ns demo-ns

# Create a service account in the namespace
kubectl create sa demo-user -n demo-ns

# Create a test secret
kubectl create secret generic demo-secret -n demo-ns --from-literal 'message=hey-there'

# Check that you can read the secret
kubectl get secret demo-secret -n demo-ns -o jsonpath='{.data.message}'|base64 --decode

# Create a test pod to try to query the API server
kubectl run curlpod --rm -it \
--image=curlimages/curl -n demo-ns \
--overrides='{ "spec": { "serviceAccount": "demo-user" }  }' -- sh

#############################################
# From within the pod run the following
#############################################
# Point to the internal API server hostname
export APISERVER=https://kubernetes.default.svc

# Path to ServiceAccount token
export SERVICEACCOUNT=/var/run/secrets/kubernetes.io/serviceaccount

# Read this Pod's namespace
export NAMESPACE=$(cat ${SERVICEACCOUNT}/namespace)

# Read the ServiceAccount bearer token
export TOKEN=$(cat ${SERVICEACCOUNT}/token)

# Reference the internal certificate authority (CA)
export CACERT=${SERVICEACCOUNT}/ca.crt

# Explore the API with TOKEN
# This call will pass
curl --cacert ${CACERT} --header "Authorization: Bearer ${TOKEN}" -X GET ${APISERVER}/api

# This call to get secrets will fail
curl --cacert ${CACERT} --header "Authorization: Bearer ${TOKEN}" -X GET ${APISERVER}/api/v1/namespaces/$NAMESPACE/secrets/

# Now run it under a watch to trigger continuous deny errors
watch 'curl --cacert ${CACERT} --header "Authorization: Bearer ${TOKEN}" -X GET ${APISERVER}/api/v1/namespaces/$NAMESPACE/secrets/'
Update Stream Analytics to Look for Forbidden Requests
So, we have a user trying to execute requests against our cluster for which they are not authorized. We can easily update our stream analytics query to filter out forbidden requests against our namespace.
-
Navigate back to your ‘Stream Analytics’ instances in the Azure Portal
-
If the job is still running, make sure you click ‘Stop job’ as you cannot edit queries while the job is running
-
Click on the ‘Query’ tab
-
Update the query as follows, to filter out audit messages about our ‘demo-ns’ namespace that also have a status code of 403 (Forbidden)
Note: Be sure that your ‘FROM’ still points to your Event Hub input target and that your ‘INTO’ still points to your Service Bus output target.
 WITH DynamicCTE AS (
 SELECT UDF.jsonparse(individualRecords.ArrayValue.properties.log) AS log
 FROM [logfilterhub28026]
 CROSS APPLY GetArrayElements(records) AS individualRecords
 )
 SELECT *
 INTO [kubeaudit]
 FROM DynamicCTE
 WHERE log.objectRef.namespace = 'demo-ns'
 AND log.responseStatus.code = 403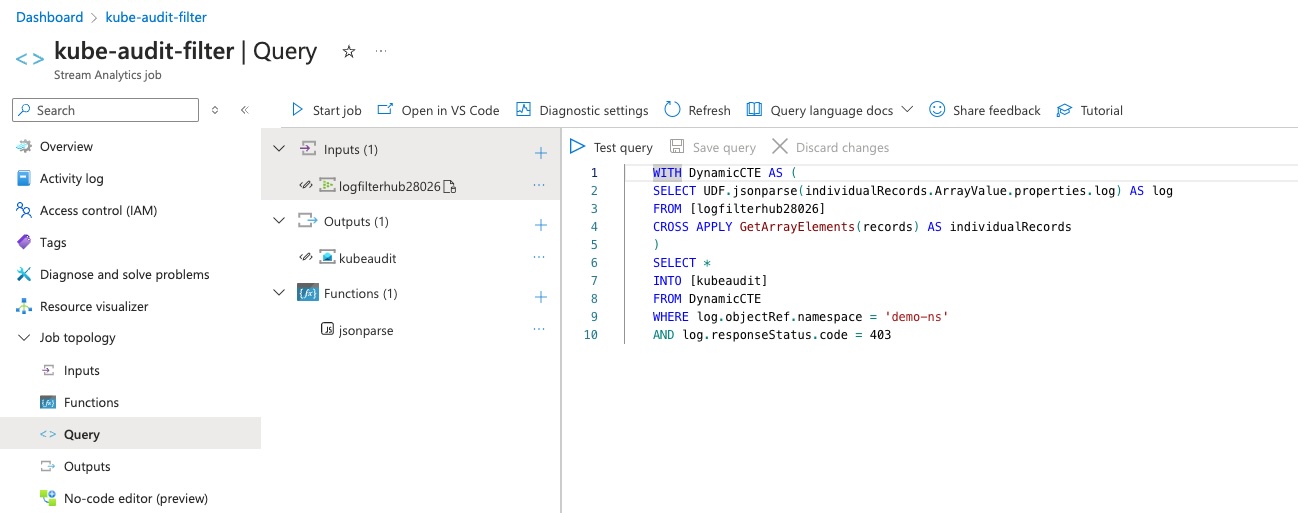
- Click ‘Save query’
- Once the save completes click ‘Start Job’
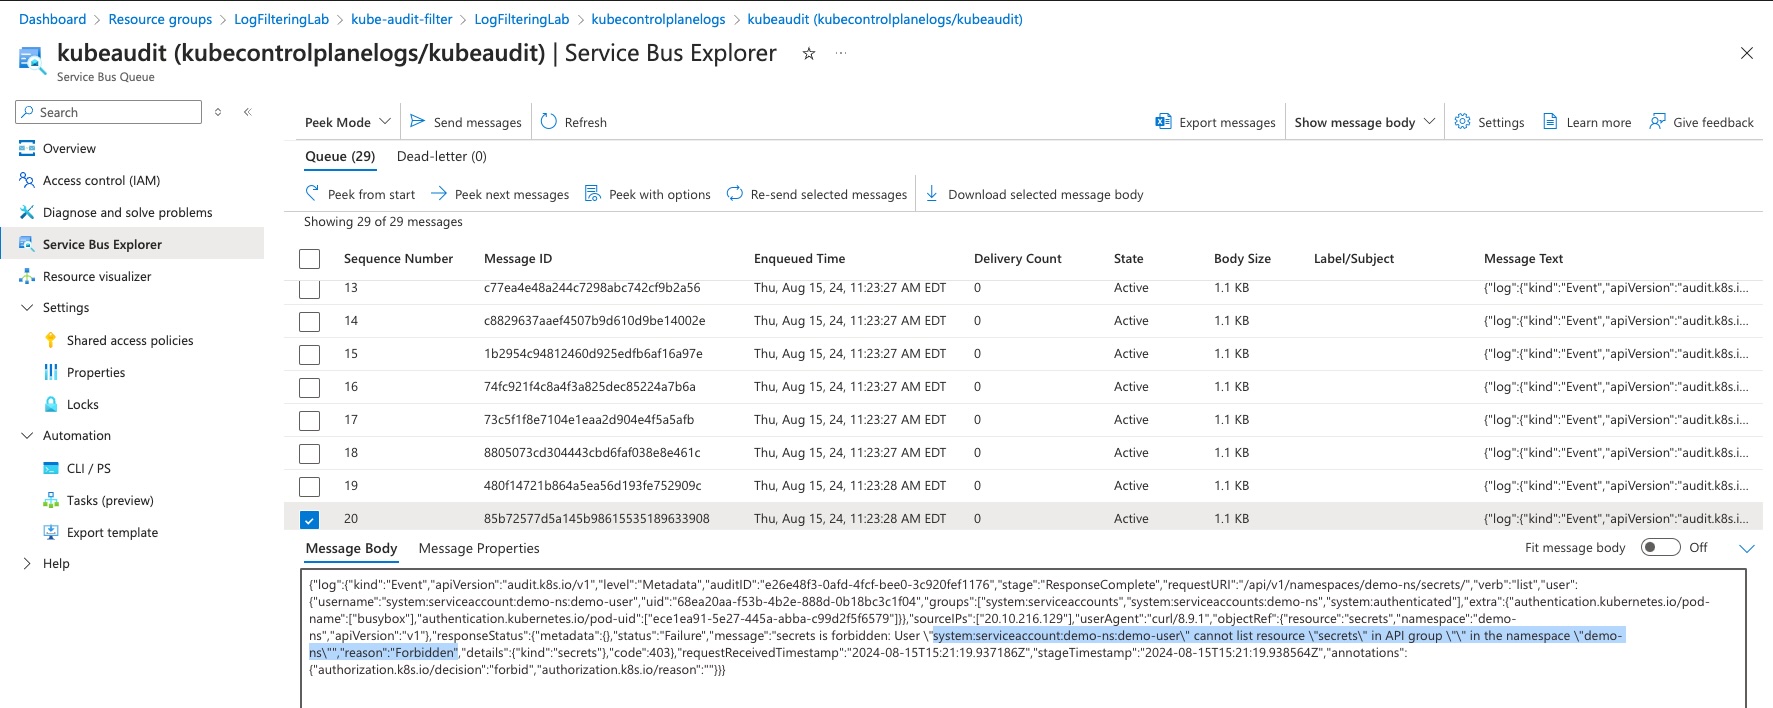
Once your job is started, you should be able to navigate back to your Service Bus Queue and watch the messages flowing through.
Conclusion
Congratulations! You now have an end-to-end fully working Stream Analytics instance that can filter AKS control plane logs to extract specific messages. You can manipulate the diagnostic settings to add additional logs to the input and modify the query to extract the exact messages critical to your cluster’s health and security. This is an extremely versatile solution that is also capable of handling log records of multiple clusters across your enterprise.